The State of Basketball in Seattle

Thanks to Graham for this question on Whale.

First, we have to start with Nathan Hale High School which has the number one boys basketball team in the nation. Last year they were 3-18, but that was before former NBA start Brandon Roy joined as the team’s head coach and they received seven out-of-district transfers including Michael Porter Jr., the nation’s No. 1-ranked recruit in the 2017 class. Michael has signed a letter of intent to play for the University of Washington next year. His brother Jontay also plays for the team and is currently ranked as the 26th best player in the 2018 class.

Seattle’s Garfield High School is ranked 79th in the nation. Not bad considering the US has 37,000 public and private high schools.

The University of Washington men aren’t doing well as a team and have just a 9-11 record. They do, however, have Markelle Fultz who is a potential number one pick in next year’s NBA Draft. And there are currently eight former UW players in the NBA.

The UW women, however, are currently 19-2 and ranked 7th in the nation. Kelsey Plum is the all-time Pac-12 scoring leader. As I write this she’s just 323 points shy of being the NCAA all-time women’s leader in points scored.

There is also the Seattle Pro Am, which last year featured a number of current NBA Players.

And who can forget that the outdoor court at Greenlake, popular for pick-up games during the summer (when it’s not raining) was once featured in NBA Street Vol. 2. Greenlake is occasional host to amateur slam dunk contests, including one hosted by Shawn Kemp.

Which reminds me, in Seattle we never talk about the Sonics.

Why I Voted Against Seattle’s ST3 Light Rail Expansion

It is looking more likely that the Seattle area’s $54 billion ST3 light-rail extension will be approved. I voted against it. Here is why.

Being cool isn’t the same thing as being effective

Underlying many of the pro-light-rail arguments that abound — at least those by the casual voter I see on Facebook and overhear around the city — is an air of coolness and futurism. This isn’t articulated explicitly, but here’s a thought experiment to get my point across: suppose we had a ballot proposal to spend $54 billion on a bus expansion package (bus only express lanes, new long-range hybrid buses, more city-to-city bus routes, etc.). What would the reaction be? Probably something like, “Are you kidding me, $54 billion for a bunch of buses?!?! We could build light-rail for that much!” We could (or maybe not as I’ll discuss), but the question is why is light-rail inherently better than other alternatives?

What I hear most are rants about how China and Japan have high-speed rail, how Europe survives on it, how great it was to visit San Francisco and be able to take the BART. Obviously all of this is awesome so of course we should have more rail lines.

Yes, it is indeed great to rail around San Francisco on a train system that you did not pay to construct and do not pay to maintain in a city in which your main purpose is sightseeing not living and commuting to work. But the year is now 2016 and the question is whether we should spend $54 billion and 25 years building a light-rail system or think harder about the alternatives.

It doesn’t pass the sniff test

The one argument you do hear regarding the ST3 expansion is Seattle’s increasingly horrendous traffic. The scrawling of Seattle locals on Facebook every time a new “Top 10 Worst Cities for Traffic” is a smug reminder that if light-rail would’ve actually gotten funded 30 years ago “when it should have” that we wouldn’t have this traffic problem: “Gee, do you think we need light-rail?” the fake rhetoric proceeds.

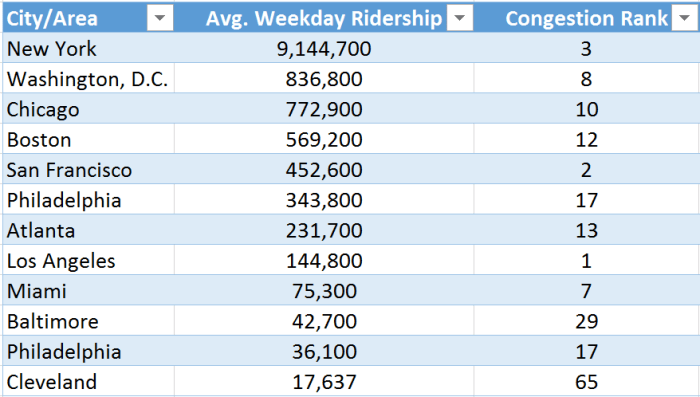
But this argument doesn’t pass the sniff test. Rail ridership does not largely correlate with reduced congestion. I put together a simple dataset to show this (table below). Many of the cities with the largest weekly U.S. rail ridership also have the worst congestion.

Does this simple table prove we shouldn’t expand light-rail? No. It’s only a sniff test. But that’s precisely the point. The story is more complicated so we should think harder when drawing a direct line from Seattle’s congestion problems to its lack of expansive rail.

(By the way, researchers have found similarly negligent effects on congestion from light-rail and here is more research on the issue).

Capture.PNG

The project violates a basic economic principle

The principle being that projects should be paid for by the people that use them. Although this principle is mostly adhered to in the current budget, there is still $4.67 billion in federal grant funding meaning tens of millions of Americans that never ride Seattle’s light-rail will end up paying for it. Sure, we end up paying for a bunch of projects we’ll never use in cities we’ll never visit, but that doesn’t mean we should impose the same cost on others.

The principle is violated at the local level too since every tax payer will help front the bill for light-rail regardless of whether they end up riding it (a very small portion of operating costs come from fare revenue).

It costs ALOT (and will probably cost more)

It costs $54 billion!!! That’s a lot of money!!! And $28 billion of that is increased taxes. And that’s a lot of money!!! Sure cost alone does not indicate the merit of a project, but it does mean we should think really, really hard before moving forward. And it puts the onus on the proposers to make a very strong case about why the project is going to be awesome. In my view they haven’t done that.

And if history is any indication it could actually cost (much) more. This was written about the original lightrail project back in June of 2013:

Sound Transit’s light-rail system, called Link, has also had its share of challenges. The 25 miles of light rail that voters were told would be completed by 2006 at a cost of $1.7 billion, have resulted in 23 miles of track which, when completed, will end up costing $5.2 billion.

In other words the project cost 3 times more than originally projected for two fewer miles.

Overruns of these magnitudes are the rule not the exception. Here, Bent Flybbjerg has done great work (I recommend this interview). His research on megaprojects is gloomy (a megaproject is one that costs more than $1 billion and affects more than 1 million people). In a 2014 paper he wrote the following (emphasis mine):

Performance data for megaprojects speak their own language. Nine out of ten such projects have cost overruns. Overruns of up to 50 percent in real terms are common, over 50 percent not uncommon. Cost overrun for the Channel tunnel, the longest underwater rail tunnel in Europe, connecting the UK and France, was 80 percent in real terms. For Denver International Airport, 200 percent. Boston’s Big Dig, 220 percent. The UK National Health Service IT system, 400-700 percent. The Sydney Opera House, 1,400 percent (see more examples in Table 2). Overrun is a problem in private as well as public sector projects, and things are not improving; overruns have stayed high and constant for the 70-year period for which comparable data exist. Geography also does not seem to matter; all countries and continents for which data are available suffer from overrun. Similarly, benefit shortfalls of up to 50 percent are also common, and above 50 percent not uncommon, again with no signs of improvements over time and geography (Flyvbjerg et al., 2002, 2005).

ST3 will serve mostly current transit riders

The Washington Policy Center used Seattle Sound Transit figures to estimate that only 28 thousand new daily riders would be added by 2040. What they found is, well, troubling (emphasis mine):

This means that under ST3, each new transit rider will cost over $1 million dollars.

It also means that 97% of the one million new residents expected in 2040 will likely not be using Sound Transit’s costly services, meaning Sound Transit officials do not meet the demand for mobility they themselves anticipate.

If Sound Transit officials want to keep hypothesizing what they can do in theory – using the median price of a single-family home in King County, they could buy every new passenger a home and still have plenty left over ($38.2 billion) for:

– 8,000 new hybrid articulated buses
– Paying back taxpayers for the SR 520 bridge replacement
– Eliminating tolls and providing tax relief on the Viaduct replacement project
– Expanding I-90 through Snoqualmie Pass

Yet even after all this spending, they would still have enough left to buy those same homes for the 4,505 homeless people in Seattle, ending homelessness in the city with $21.8 billion still left in their bank accounts.

And here’s the abstract of a 2015 study making a similar point (emphasis mine):

We examine American support for transit spending, and particularly support for financing transit with local transportation sales taxes. We first show that support for transportation sales tax elections may be a poor proxy for transit support; many voters who support such taxes do not support increased transit spending, and many people who support transit spending do not support increased sales taxes to finance it. We then show that support for transit spending is correlated more with belief in its collective rather than private benefits—transit supporters are more likely to report broad concerns about traffic congestion and air pollution than to report wanting to use transit themselves. These findings suggest a collective action problem, since without riders transit cannot deliver collective benefits. But most transit spending supporters do not use transit, and demographics suggest they are unlikely to begin doing so; transit voters are wealthier and have more options than transit riders.

There are better alternatives

As Edward Glaeser recently said in an interview with Vox.com:

There’s a strong consensus that maintaining existing infrastructure gives you much more bang for your buck. There have been diminishing returns to building new roads, particularly since we completed the National Highway System. Whereas if you have existing corridors with potholes, the returns to fixing that are very high. [See here for more.]

Another area of agreement among transportation economists is a profound enthusiasm for buses over trains. Bus rapid transit is considered a very high-return investment. These aren’t necessarily buses operating on crowded city streets; these are buses with dedicated lanes that can achieve almost the same speed as trains.

The beauty of buses, from a cost-benefit perspective, is you don’t need to lay down massive infrastructure that you’re stuck with forever. If a bus route doesn’t attract enough people, you switch the route. Or you stop running it. It’s flexible in a way that trains aren’t. And that’s tremendously valuable in a world of uncertainty.

Now, this is not about gutting the subway in New York or the Metro in Washington, DC. But for new stuff, investing in buses tends to make more sense given the modest densities of most American metropolitan areas.

No, I don’t hate light-rail

In fact I live in Seattle and take it to work daily. And I love trains in general. I once traveled from Hong Kong to Madrid completely by train (just thought I’d find a way to throw that in there). But I see critical problems with the current proposal and I have mixed feelings about Seattle’s current light-rail.

For one, Seattle’s light-rail is rarely full except during a morning rush hour and again during an evening one. And even during these peak times the capacity is fractions of that seen on Asian rail lines (I’ve lived in Seoul) and even many in Europe. Sure, some people may see that as a feature and not a bug, but when current capacity is easily met and we’re already talking about spending $54 billion on a new system I think it’s time to stop and think. Yes, the city is growing and will likely continue to grow, the question is what is the benefit of light-rail in that climate and are there better and cheaper alternatives.

This is not to mention my commute is actually 25 minutes longer under the current light-rail regime because the 71, 72, and 73 buses were all rerouted from an express lane route that led directly downtown. Now they go — guess where — to the nearest light-rail station.

Third, the four crucial light-rail stops downtown use the same tunnel as bus traffic and so are subject to the same delays. If a bus breaks down or is slow letting passengers off, the light-rail must wait for the bus to move on. If you are not from Seattle you might have though that the original $5 billion construction project would’ve gotten light-rail a dedicated track, but you’d only be correct outside of the downtown area. These are not theoretical delays; these are daily delays. This is not life’s biggest tragedy, but we all know the feeling of wanting to get home after a long day and when you’re on a motionless train stuck behind a bus (!) and are delayed for two minutes at each of four out of your total six stops you do start to question if the money was worth it.

New UW Report Finds Seattle’s Minimum Wage Doing Modestly Well For Some Low-Wage Workers

Recently a few friends of mine have linked to this article, which summarizes a new University of Washington study about the Seattle minimum wage increase. The article headline reads, “New UW Report Finds Seattle’s Minimum Wage Is Great for Workers and Businesses.” My friends like to add snarky comments feigning surprise, implying that of course the minimum wage is great for workers and businesses.

SMH.

1. The “of course” intuition runs in the opposite direction.

Demand curves almost always slope downward so our naive intuition would be that business will shed low-wage workers because they cost more under a minimum wage regime. It was only after David Card and Alan Krueger’s 1993 paper (and the subsequent papers that utilized a similar difference-in-difference strategy*) that economists had hard evidence that small minimum wage increases might not reduce employment.

*Difference-in-Difference is an easily understood technique in which you compare the starting and ending points of two different rates to see how they performed relative to one anther. My mile time was 11 minutes last year, but now it’s 10 minutes. Your mile time was 11:30, but now it’s 9 minutes. I improved by one minute, but you improved by two minutes and thirty seconds. One minute and thirty seconds is the difference between our individually differenced before and after times, which is where the technique gets its name (difference is just another word for subtraction).

Suppose we’re genetically similar, say, for example, that we’re twins. We now know that the difference in our mile time improvements over the past year was due to our different training regimens and not genetics and — setting aide the fact that we only have a sample size of two — we now have proof that your workout regimen is better (at least for people that share similar genes).

The attractive thing about difference-in-difference experiments is that they don’t use any fancy math: the results are both easy to calculate and easy to understand. If you can find two people — or groups, or cities, or things — that are similar and can track their performance over time all you have to do at the end is subtract a couple of times and you have a statistically valid result.

2. The headline and content of the article sorely misrepresents the results of the study.

The article’s author cites only the Seattle increase portion of the difference-in-difference approach. It’s the equivalent of me citing my increased mile time and telling you how great my workout plan is without telling you that my twin did much better with a totally different workout plan. Most of the increase in employment and business success was due to the recent strength of the Seattle economy. An acquaintance that recently started at Amazon told me they just had their largest orientation ever, 600 new employees.

Ultimately the authors conclude with this finding:

The major conclusion one should draw from this analysis is that the Seattle Minimum Wage Ordinance worked as intended by raising the hourly wage rate of low-wage workers, yet the unintended, negative side effects on hours and employment muted the impact on labor earnings.

The authors don’t find that the minimum wage increase was “great” for businesses, but instead mostly a wash. There was a small, 0.7 percentage point, increase in the rate of business closure. The authors also note that:

A higher minimum wage changes the type of business that can succeed profitably in Seattle, and we should thus expect some extra churning. Our results are consistent with those of Aaronson, French, and Sorkin (2016), who conclude that minimum wage laws prompt increases in both entries and exits (particularly in chains), with closures coming from more labor intensive industries and establishments, and more openings occurring in more capital intensive industries.

I think this structural realignment is foreboding for the future of Seattle’s low-wage workers. The minimum wage currently stands at “only” $11 and we’re a year into the experiment. What happens in seven years and an additional $7 in hourly pay? There could be serious negative structural adjustments to low-wage industries.

So what about the workers themselves? The best estimate is that the minimum wage decreased low-wage employment by 1 percentage point. Far from “great.” The workers that were still employed did experience modest gains in material well-being:

Seattle’s low-wage workers who kept working were modestly better off as a result of the Minimum Wage Ordinance, having $13 more per week in earnings and working 15 minutes less per week.

One has to ask themselves if the minimum wage was so great why didn’t low-wage workers flood into the Seattle area? On the contrary the authors find the following:

…we conclude that the Seattle Minimum Wage Ordinance reduced the probability of low-wage workers continuing to work in the Seattle (rather than elsewhere in the state) by 2.8 percentage points.

So bad was the misrepresentation of this article, which my friends footnote with duh-obviously-the-minimum-wage-is-great style comments, that Jake Vigdor, the lead author of the study, himself responded in the comments section:

As director of the Seattle Minimum Wage Study, it is my sad duty to report that this article grossly mischaracterizes the tenor of our report. I encourage readers to refer directly to that report:https://seattle.legistar.com/View.ashx?M=F&ID=4579065&GUID=39743A75-1D9F-4C32-B793-2F699D51B0F7


3. An argument against the minimum wage is not an argument to condemn the poor.

The minimum wage is only one poverty reduction strategy. Many economists are in favor of small increases in the minimum wage because there is a lot of evidence that suggests the impact on employment is small or non-existent (or even slightly positive). But many economists are quite nervous or ambivalent about $15 minimum wage increases. As this Forbes headline notes, “Even Alan Krueger Thinks That A $15 An Hour Minimum Wage Is Too High.” And Alan Krueger helped pioneer the argument in favor of the minimum wage!

See this poll and this poll for reference.


4. Shouldn’t we read things before we comment about them?

This echos my thoughts in an early post about things I do and don’t hear in Seattle.

S.L.U.T. Shaming

Just today I found this 2014 Matthew Yglesias article from VOX that mentions the dismal ROI of street cars. It turns out Matt has written lots of articles on street cars and public transportation more broadly (see this and this, for example), often arguing that buses are a better solution (partly because of cost). That in turn lead me to relisten to this EconTalk episode with Bent Flyvbjerg on megaprojects, which I highly recommend.

In recent years Seattle has opened two new streetcars, which appear to me to be totally useless, and I was happy to see Matt agreed in general. One of the strangest things is that the streetcars run on normal surface streets for portions of their routes, which means they’re subject to the same traffic delays as cars…and buses.

It lead me to look up some data on Seattle’s South Lake Union Trolley (affectionately known in Seattle as the S.L.U.T.).

Even a glance at the Wikipedia page presents trouble. Built in 2008, the S.L.U.T only carries 2,200 people per day, but has a capacity of 12,600, meaning daily ridership is less than 20 percent of capacity. Second, ridership has gone down (!) several hundred riders from the peak years 2011-2013. The South Lake Union area of Seattle is home to Amazon and many other companies and is being built up extremely quickly (new condos all around the area). Traffic there is simply horrific, which makes the ridership numbers even worse since it means people are using public transportation less as traffic worsens.

Matt suggested buses are a better alternative, which seems intuitive after you see how these trolleys operate. The S.L.U.T ended up costing $56 million (it’s just 1.3 miles long), and again as Matt suggests seems much more geared toward making the area seem hip and cool and shuttling around Amazonians than it does toward decreasing congestion. Indeed, this Seattle PI article details some of the political aspects of the plan, notably that “Paul Allen’s Vulcan owns 60 acres in the neighborhood, much of it along the streetcar line.” Vulcan was a major proponent of the project. A prominent selling point to local businesses was that property values would go up $100,000 or more.

I ran some simple numbers to compare the S.L.U.T with a comparable investment in buses. Out of the $56 million spent on S.L.U.T., 25 million was fronted by South Lake Union property owners (again, suggestive of why it was built in the first place), money that certainly wouldn’t have been available had buses been purchased instead. This leaves a potential $31 million budget. Buses cost around $500,000k for diesel options and as much as $1 million dollars for newer battery-powered coaches.

Running some numbers from King County Metro gives an average of 210 passengers per bus during weekdays. Even if Seattle went with the more expensive battery-powered buses and left $15 million for operating costs (meaning the city purchased 15 buses), daily capacity would still be 1,000 passengers more than ride the S.L.U.T. daily. And even this figure is misleading because the 210 number is based on people that actually ride the bus, not total capacity, which is likely much higher.

What’s more buses have many more advantages. For example, you don’t have to block roads for months at time to construct tracks within the road. And since they don’t run on tracks buses are obviously more geographically  flexible. Additionally, the average bus route is much more than 1.3 miles in length and buses serve poorer areas, which South Lake Union certainly is not.

Politically, though, this was never going to happen. Seattle buses are run by King County Metro Transit, but the S.L.U.T. was paid for by the Seattle Department of Transportation.