Kelsey Plum’s Chase for #1

Thanks to Graham for this question on Whale. Graham asked about Kelsey Plum and whether she will break the record?

“What record?” you might ask. Plum is very close to becoming the all-time NCAA women’s basketball scoring leader. That’s a really big deal and probably one of the under reported stories in basketball right now. NCAA Women’s Basketball started in 1981, that’s 35 years worth of basketball. Plum will have scored more points than greats like Brittney Griner, Chamique Holdsclaw, and Cheryl Miller.

In December of last year Plum became the all-time Pac-12 scoring leader with 44 points in a win against Boise State. She had 44 points again on Sunday in a 72-68 loss to Stanford.

Plum is now averaging 31.4 points per game (to go along with 5 rebounds and 5 assists) and now sits third all time, just 255 points away from Jackie Stiles who set the record 15 years ago with 3,393. The UW Women have 8 games to go in the regular season and if Plum keeps up her average she’ll fall just shy of the record by season’s end with 3,388 points. Luckily, the UW Women are all but guaranteed at least two post-season games, one in the Pac-12 tournament and another in the NCAA tournament, which they’ll likely make even if they fall in the first round of the Pac-12. They could play up to nine games if they make it to the final in both, but will likely end up playing somewhere around six or seven games. Still, this gives Plum plenty of time to break the record and I predict she’ll surpass it by 100 or 150 points.

I plotted the graph below using R to show Plum’s chase for the record.

kelsey_plum_prediction

The State of Basketball in Seattle

Thanks to Graham for this question on Whale.

First, we have to start with Nathan Hale High School which has the number one boys basketball team in the nation. Last year they were 3-18, but that was before former NBA start Brandon Roy joined as the team’s head coach and they received seven out-of-district transfers including Michael Porter Jr., the nation’s No. 1-ranked recruit in the 2017 class. Michael has signed a letter of intent to play for the University of Washington next year. His brother Jontay also plays for the team and is currently ranked as the 26th best player in the 2018 class.

Seattle’s Garfield High School is ranked 79th in the nation. Not bad considering the US has 37,000 public and private high schools.

The University of Washington men aren’t doing well as a team and have just a 9-11 record. They do, however, have Markelle Fultz who is a potential number one pick in next year’s NBA Draft. And there are currently eight former UW players in the NBA.

The UW women, however, are currently 19-2 and ranked 7th in the nation. Kelsey Plum is the all-time Pac-12 scoring leader. As I write this she’s just 323 points shy of being the NCAA all-time women’s leader in points scored.

There is also the Seattle Pro Am, which last year featured a number of current NBA Players.

And who can forget that the outdoor court at Greenlake, popular for pick-up games during the summer (when it’s not raining) was once featured in NBA Street Vol. 2. Greenlake is occasional host to amateur slam dunk contests, including one hosted by Shawn Kemp.

Which reminds me, in Seattle we never talk about the Sonics.

Athletic Performance

Several related articles on athletic performance have come out this week.

1. We Are Nowhere Close to the Limits of Athletic Performance (Nautilus)

…Mike Israetel, a professor of exercise science at Temple University, has estimated that doping increases weightlifting scores by about 5 to 10 percent. Compare that to the progression in world record bench press weights: 361 pounds in 1898, 363 pounds in 1916, 500 pounds in 1953, 600 pounds in 1967, 667 pounds in 1984, and 730 pounds in 2015. Doping is enough to win any given competition, but it does not stand up against the long-term trend of improving performance that is driven, in part, by genetic outliers.

And this:

If CRISPR-related technologies develop as anticipated, designer humans are at most a few decades away…Because complex traits are controlled by so many variants, we know that there is a huge pool of untapped potential that no human—not Shaq, Bolt, or anyone else—has come close to exhausting…The nature of athletes, and the sports they compete in, are going to change due to new genomic technology. Will ordinary people lose interest? History suggests that they won’t: We love to marvel at exceptional, unimaginable ability. Lebron and Kobe and Shaq and Bolt all stimulated interest in their sports. The most popular spectator sport of 2100 might be cage fights between 8-foot-tall titans capable of balletic spinning head kicks and intricate jiu-jitsu moves. Or, just a really, really fast 100m sprint. No doping required.

2. Magic Blood and Carbon-Fiber Legs at the Brave New Olympics (Scientific American)

So, as the rules stand: having an incredibly rare gene mutation that boosts red blood cells—okay; training at altitude to boost red blood cells—okay; shelling out thousands of dollars to sleep in a tent that simulates altitude—okay; injecting a drug, one approved for other medical uses that causes your body to act as if it’s at altitude—you’re a disgrace. How should we draw the line? Where does a fair advantage end and cheating begin?

…These judgments must be grounded in which of the voluntarily accepted obstacles we deem critical to the meaning of a given sport. We’re in for a lot of arbitrary decisions about fairness. Yes, altitude tents; no, low-friction, full-body swimsuits. The best we can do is start an earnest conversation about what it is we hope to get out of each sport. I hope that is what we are doing right here.

3. Caster Semenya And The Logic Of Olympic Competition (The New Yorker)

Great discussion, hard to excerpt, but for starters:

N.T.: Caster Semenya, the South African middle-distance star, who has what are called “intersex conditions.” She has always identified as a woman, but she has many of the physiological features of a man, including internal testes and an exceptionally high testosterone level. Do you think she should be allowed to compete as a woman?

M.G.: Of course not! And why do I say of course not? Because not a single track-and-field fan that I’m aware of disagrees with me. I cannot tell you how many arguments I’ve gotten into over the past two weeks about this, and I’ve been astonished at how many people fail to appreciate the athletic significance of this. Remember, this is a competitive issue, not a human-rights issue. No one is saying that Semenya isn’t a woman, a human being, and an individual deserving of our full respect.

And this:

N.T.: Right now, women’s middle-distance running is about as doped up as the Tour de France was in the nineteen-nineties.

M.G.: The women’s fifteen hundred in the 2012 Olympics was worse! As of right now, about half the field has been investigated for doping schemes since then. It’s a mess!

4. The Caster Semenya debate (The Science of Sport)

We have a separate category for women because without it, no women would even make the Olympic Games (with the exception of equestrian). Most of the women’s world records, even doped, lie outside the top 5000 times run by men. Radcliffe’s marathon WR, for instance, is beaten by between 250 and 300 men per year. Without a women’s category, elite sport would be exclusively male.

That premise hopefully agreed, we then see that the presence of the Y-chromosome is THE single greatest genetic “advantage” a person can have. That doesn’t mean that all men outperform all women, but it means that for elite sport discussion, that Y-chromosome, and specifically the SRY gene on it, which directs the formation of testes and the production of Testosterone, is a key criteria on which to separate people into categories.

So going back to the premise that women’s sport is the PROTECTED category, and that this protection must exist because of the insurmountable and powerful effects of testosterone, my opinion on this is that it is fair and correct to set an upper limit for that testosterone, which is what the sport had before CAS did away with it.

The advantage enjoyed by a Semenya is not the same as the one enjoyed by say, Usain Bolt, or LeBron James, or Michael Phelps, because we don’t compete in categories of fast-twitch fiber, or height, or foot size (pick your over simplification for performance here). So Semenya has a genetic advantage, by virtue of A) having a Y-chromosome and testes, and B) being unable to use that T and/or one of its derivatives enough to have developed fully male.


5. This Is Why There Are So Many Ties In Swimming (DeadSpin)

In a 50 meter Olympic pool, at the current men’s world record 50m pace, a thousandth-of-a-second constitutes 2.39 millimeters of travel. FINA pool dimension regulations allow a tolerance of 3 centimeters in each lane, more than ten times that amount. Could you time swimmers to a thousandth-of-a-second? Sure, but you couldn’t guarantee the winning swimmer didn’t have a thousandth-of-a-second-shorter course to swim.

Incidentally, American football has the opposite problem, the length of the field is (likely) quite accurate, but measurement — at least of where the ball is spotted after a play — is inaccurate:

Joey Faulkner — an Astronomy PhD student who we assume did not grow up watching American football because he’s British — collected a massive amount of NFL game data to prove that the official spotting of footballs is neither arbitrary nor accurate.

Surprisingly, this is by design:

If this is indeed the spot, then there should have been a measurement, but there wasn’t. So was the umpire’s spot a mistake? No. It was intentional. By moving back a half yard, the chain can now be placed exactly on the 21-yard line. Now the officials need only to see if the ball advances past the 11-yard line for the next first down. And with yard markers all over the field, this is easy for an official to see without needing the chain.

In other words, the Seahawks lost a half yard simply because the officials wanted to make it easier to know whether it will be a first down on the next set of downs.

6. This Kenyan Olympic Javelin Thrower Taught Himself with Youtube Videos, Now He’s a Champion (Atlanta BlackStar by way of Playground)

In the video by Playground Magazine, Julius Yego reveals that he taught himself how to throw a javelin by watching YouTube videos and through trial and error. The 28-year-old has earned five gold medals in his young career.

Durant to the Warriors

In breaking news (that I myself did not break) Kevin Durant has signed with the Golden State Warriors.

Thoughts

1. Haters gonna hate.
The haters have already come out en mass calling Durant a traitor, saying that his exit is worse than The Decision (LeBron James’s announcement that he was leaving Cleveland to go to the Miami Heat). I always find this point of view strange. Try applying the logic to anything else in life and it sounds absurd: You graduate college. You don’t get to choose where you get a job, instead you are “drafted” by Microsoft. You try diligently for nine years to overtake Apple. You fail. Your teammates are great, but an even better team awaits at Facebook that has an even better chance of overtaking Apple as the world’s top technology company. You decide to leave. Who will call you a traitor?

On the other hand there is this:

13606469_10105278370854398_2005399536903163743_n.jpg

2. Sports matter.
The thought experiment above is just a reframing of the idea that sports really matter to people. Their brains turn off, tribal affiliation and emotions kick in. I always find it silly when non-sports fans deride enthusiasm toward sport and suggest we devote that energy to “something that matters.” Sports matter. As much as anything in our society sports matter. To millions (billions?) of people around the world a fan’s home team is a part of their identity and rooting for another team is as unimaginable as adopting another family. In a very real sense their home team and their home team’s fans are a part of their family.

Screen Shot 2016-07-04 at 11.02.09 AM.png Screen Shot 2016-07-04 at 11.00.59 AM.png

3. The best ever.
The Warriors’ starting lineup is now considered the best ever. Last year — without Durant — they won 73 games, the most in NBA history! More than teams that included Michael Jordan, Magic Johnson, LeBron James. Durant is the second best player of his generation behind LeBron and one of the best players of all time. Steph Curry is the best player of his generation. The Warriors already had arguably the two best 3-point shooters of all time in Curry and Thompson. Now they have three of the top — what? Maybe 10 or 20 — shooters of all time! Draymond Green is one of the best all around players in the league, perhaps of all time by the time he retires (he finished second in NBA Defensive Player of the Year Award voting in 2016 and second in triple doubles). Three of the Warriors’ new starting five received regular season MVP votes last year. Between Durant and Curry they’ve won the past three regular season MVPs. Iguodala came in second for the NBA’s Sixth Man Award this year (and won the Finals MVP a year ago). Has any team like that ever been assembled?  The Warriors’ 12-man lineup includes many solid roll players so even if you replace Iguodala with Bogut or Livingston you still create the greatest lineup ever (Update: Bogut will likely be traded to clear up cap space for Durant).

Screen Shot 2016-07-04 at 10.50.01 AM.png

4. But remember…
The Championship was handed to the Miami Heat after LeBron, Wade, and Bosh joined forces in 2010. That team went 2-2 in the Finals. An accomplishment to be sure, but it’s not like we could just pencil them in as champions every year. Remember when Howard and Nash joined the Lakers? They became a favorite to get to the finals; they didn’t even make the playoffs. Let’s not speak too soon about the success of these new Warriors.

Screen Shot 2016-07-04 at 10.45.27 AM.png

5. Russell Westbrook must be PISSED.
Steph Curry is one of Westbrook’s most hated foes and now Durant — the man that once called Westbrook a brother — has left to play with that foe. Ouch!

Screen Shot 2016-07-04 at 10.41.59 AM.png

Testing Tony Kornheiser’s Football (Soccer) Population Theory

Fans of the daily ESPN show Pardon the Interruption (PTI) will be familiar with the co-host’s frequent “Population Theory.” The theory has a few formulations; it is sometimes asserted that when two countries compete in international football the country with the larger population will win, while at other times it’s stated that the more populous country should win.

The “Population Theory” sometimes also incorporates the resources of the country. So, for example, Kornheiser recently stated that the United States should be performing better in international football both because the country has a large population, but also because it has spent a large sum of money on its football infrastructure.

I decided to test this theory by creating a dataset that combines football scores from SoccerLotto.com with population and per capita GDP data from various sources. Because of the SoccerLott.com formatting the page wasn’t easily scraped by R or copied and pasted into Excel, so a fair amount of manual work was involved. Here’s a picture of me doing that manual work to breakup this text 🙂

IMG_4265

The dataset included 537 international football games that took place between 30 June 2015 and 27 June 2016. The most recent game in the dataset was the shocking Iceland upset over England. The population and per capita GDP data used whatever source was available. Because official government statistics are not collected annually the exact year differs. I’ve uploaded the data into a public Dropbox folder here. Feel free to use it. R code is provided below.

Per capita GDP is perhaps the most readily available proxy for national football resources, though admittedly it’s imperfect. Football is immensely popular globally and so many poor countries may spend disproportionately large sums on developing their football programs. A more useful statistic might be average age of first football participation, but as of yet I don’t have access to this type of data.

Results

So how does Kornheiser’s theory hold up to the data? Well, Kornheiser is right…but just barely. Over the past year the more populous country has won 51.6% of the time. So if you have to guess the outcome of an international football match and all you’re given is the population of the two countries involved then you should indeed bet on the more populous country.

Of the 537 games, 81 occurred on a neutral field. More populous countries fared poorly on neutral fields, winning only 43.2% of the time. While at home the more populous country won 53.1% of their matches.

Richer countries fared even worse, losing more than half their games (53.8%). Both at home and at neutral fields they also fared poorly (winning only 45.8% and 48.1% of their matches respectively).

The best predictor of international football matches (at least in the data I had available) was whether the team was playing at home: home teams won 60.1% of the time.

To look more closely at population and winning I plotted teams that had played more than three international matches in the past year against their population. There were 410 total games that met this criteria. I also plotted a linear trend line in red, which as the figures above suggest, slopes upward ever so slightly.

population_vs_winning_perct.png

Although 527 games is a lot, it’s only a single year’s worth of data. It may be possible that this year was an anomaly and I’m working on collecting a larger set of data. As the chart above suggests many countries have a population around 100 million or less and so it would perhaps be surprising if countries with a few million more or fewer people had significantly different outcomes in their matches. But we can test this too…

When two countries whose population difference is less than 1 million play against one another the more populous country actually losses 55.9% of the time. When two countries are separated by less than 5 million people the more populous country wins slightly more than random chance with a winning percentage of 52.1%. But large population differences (greater than 50 million inhabitants) does not translate into more victories. They win just 51.2% of the time. So perhaps surprisingly the small sample of data I have suggests that population differences matter more when the differences are smaller (of course this could be spurious).

This can be further seen below in a slightly different view of the chart above that exchanges the axes and limits teams to those countries with less than 100 million people.

population_vs_winning_perct_smaller.png

R code provided below:

###################################################################################################
# James McCammon
# International Football and Population Analysis
# 7/1/2016
# Version 1.0
###################################################################################################
 
# Import Data
setwd("~/Soccer Data")
soccer_data = read.csv('soccer_data.csv', header=TRUE, stringsAsFactors=FALSE)
population_data = read.csv('population.csv', header=TRUE, stringsAsFactors=FALSE)
 
 
################################################################################################
# Calculate summary data
################################################################################################
# Subset home field and neutral field games
nuetral_field = subset(soccer_data, Neutral=='Yes')
home_field = subset(soccer_data, Neutral=='No')
 
# Calculate % that larger country won
(sum(soccer_data[['Bigger.Country.Won']])/nrow(soccer_data)) * 100
# What about at neutral field?
(sum(nuetral_field[['Bigger.Country.Won']])/nrow(nuetral_field)) * 100
# What about at a home field?
(sum(home_field[['Bigger.Country.Won']])/nrow(home_field)) * 100
 
# Calculate % that richer country won
(sum(soccer_data[['Richer.Country.Won']])/nrow(soccer_data)) * 100
# What about at neutral field?
(sum(nuetral_field[['Richer.Country.Won']])/nrow(nuetral_field)) * 100
# What about at a home field?
(sum(home_field[['Richer.Country.Won']])/nrow(home_field)) * 100
 
# Calculate home field advantage
home_field_winner = subset(home_field, !is.na(Winner))
(sum(home_field_winner[['Home.Team']] == home_field_winner[['Winner']])/nrow(home_field_winner)) * 100
 
# Calculate % that larger country won when pop diff is less than 1 million
ulatra_small_pop_diff_mathes = subset(soccer_data, abs(Home.Team.Population - Away.Team.Population) < 1000000)
(sum(ulatra_small_pop_diff_mathes[['Bigger.Country.Won']])/nrow(ulatra_small_pop_diff_mathes)) * 100
#Calculate % that larger country won when pop diff is less than 5 million
small_pop_diff_mathes = subset(soccer_data, abs(Home.Team.Population - Away.Team.Population) < 5000000)
(sum(small_pop_diff_mathes[['Bigger.Country.Won']])/nrow(small_pop_diff_mathes)) * 100
#Calculate % that larger country won when pop diff is larger than 50 million
big_pop_diff_mathes = subset(soccer_data, abs(Home.Team.Population - Away.Team.Population) > 50000000)
(sum(big_pop_diff_mathes[['Bigger.Country.Won']])/nrow(big_pop_diff_mathes)) * 100
 
 
################################################################################################
# Chart winning percentage vs. population
################################################################################################
library(dplyr)
library(reshape2)
 
base_data = 
  soccer_data %>%
  filter(!is.na(Winner)) %>%
  select(Home.Team, Away.Team, Winner) %>%
  melt(id.vars = c('Winner'), value.name='Team')
 
games_played = 
  base_data %>%
  group_by(Team) %>%
  summarize(Games.Played = n())
 
games_won = 
  base_data %>%
  mutate(Result = ifelse(Team == Winner,1,0)) %>%
  group_by(Team) %>%
  summarise(Games.Won = sum(Result))
 
team_results = 
  merge(games_won, games_played, by='Team') %>%
  filter(Games.Played > 2) %>%
  mutate(Win.Perct = Games.Won/Games.Played)
 
team_results = merge(team_results, population_data, by='Team')
 
# Plot all countries
library(ggplot2)
library(ggthemes)
ggplot(team_results, aes(x=Win.Perct, y=Population)) +
  geom_point(size=3, color='#4EB7CD') +
  geom_smooth(method='lm', se=FALSE, color='#FF6B6B', size=.75, alpha=.7) +
  theme_fivethirtyeight() +
  theme(axis.title=element_text(size=14)) +
  scale_y_continuous(labels = scales::comma) +
  xlab('Winning Percentage') +
  ylab('Population') +
  ggtitle(expression(atop('International Soccer Results Since June 2015', 
                     atop(italic('Teams With Three or More Games Played (410 Total Games)'), ""))))
ggsave('population_vs_winning_perct.png')
 
# Plot countries smaller than 100 million
ggplot(subset(team_results,Population<100000000), aes(y=Win.Perct, x=Population)) +
  geom_point(size=3, color='#4EB7CD') +
  geom_smooth(method='lm', se=FALSE, color='#FF6B6B', size=.75, alpha=.7) +
  theme_fivethirtyeight() +
  theme(axis.title=element_text(size=14)) +
  scale_x_continuous(labels = scales::comma) +
  ylab('Winning Percentage') +
  xlab('Population') +
  ggtitle(expression(atop('International Soccer Results Since June 2015', 
                          atop(italic('Excluding Countries with a Population Greater than 100 Million'), ""))))
ggsave('population_vs_winning_perct_smaller.png')

Created by Pretty R at inside-R.org

Where to Rank the UConn Women in Terms of Dominance

Unless a miracle occurs the UConn Women’s Basketball team will soon win their fourth championship in a row in an undefeated season when they beat Syracuse on Tuesday night. This will be their sixth championship since 2009. If they lose it will be one of the greatest upsets in the history of team sports.

Where does their recent dominance rank in the all-time history of sports? I put together this short survey.

The UNC women’s soccer team is — as far as I know — the most dominate team in the history of sports, collegiate or professional (at least in the U.S.), Harlem Globetrotters aside. They’ve been consistently dominate now for three decades and won 22 of the 36 NCAA National Championships. Of course U.S. women’s professional soccer has also been dominate the past 15 years with numerous World Cup and Olympic gold medal wins as well as being ranked No. 1 continuously from March 2008 to December 2014. En Espana, Barcelona has created a dominant European futbol team.

The UCLA men’s basketball team of the 1960s and 1970s won seven straight national titles under the famous John Wooden. The Iowa Hawkeyes men’s wrestling team also had an amazing run of dominance, especially throughout the 1990s. My alma matter, the University of Washington, has won five consecutive national crew championship in the men’s varsity eight. Jointly, the University of Minnesota and University of Minnesota Duluth have been dominating Women’s Ice Hockey since 2001, winning a combined 10 National Championships.

The University of Arkansas won eight consecutive national Track & Field Championships on the men’s side throughout the 1990s, while the LSU women won 11 championships in a row in the ’80s and ’90s (wow!). Swimming and diving national championships seem to come in bundles. Since 1937 only 13 different men’s teams have won national championships and many were back to back or three-peats. The women’s side is equally streaky. By the way, there are quite a few schools with swimming and diving programs.

Of course Alabama’s football team has been quite successful over the past seven years, winning four FBS championships in a rather competitive sport that has recently instituted a playoff system (Alabama has won one out of two of those).

What I’ve listed so far have been Division I-A programs only. Certainly some smaller college programs have seen dominance. And of course there are dominant high school teams as well. St. Anthony’s in New Jersey has won 27 boys’s basketball state titles in the past 39 years, for instance. Maryville Tennessee’s high school football team has gone 145-5 and won seven state titles in recent memory. Cheryl Miller, perhaps the greatest female basketball player of all time (and yes, brother of Reggie Miller), led her high school team to a record of 132-4 from ’78-’82 and along the road scored 105 points in a single game. Reggie Miller often recalls the night he found out about his sister’s scoring outburst. He had just scored 39 points and was pretty proud of himself until his sister reported back that she had more than doubled that total. I recall hearing about several boy’s wrestling champions with perfect high school careers. Here is one example.

A number of professional teams have had long periods of dominance. Chinese women’s diving has been extremely dominant recentlyThe New York Baseball Yankees have won 27 World Championships and 40 American League pennants over the past 100 years, with many of these coming over the 45-year period between 1920 and 1965. I’m aware that Russian hockey and gymnastics teams were quite great in their prime, perhaps still so.

The Boston Celtics won eight straight World Championships throughout the 1960s, helping Bill Russell win a total of 11 championship rings during his career. Indeed, Bill Russell is sometimes considered the greatest winner in the history of team sports and as such when LeBron James left Russell off of his theoretical “Mount Rushmore of the NBA” Russell was able to respond with this amazing quote regarding his own athletic success:

Hey, thank you for leaving me off your Mount Rushmore. I’m glad you did. Basketball is a team game, it’s not for individual honors. I won back-to-back state championships in high school, back-to-back NCAA championships in college. I won an NBA championship my first year in the league, an NBA championship in my last year, and nine in between. That, Mr. James, is etched in stone.

Individual athletics has also seen sportsmen and women that have been consistently dominant. Tiger Woods, Usain Bolt, Sean White, and Michael Phelps have all had multi-year stretches of dominance in recent memory. At least one of them was just featured in an inspiring commercial. Of course there were many dominant athletes in each of these sports before the current incarnations (Jack Nicklaus, Carl Lewis, Mark Spitz).  Eric Heiden won five speed skating medals in the Lake Placid Olympics, starting with the 500 meters and ending with the 10,000 meters. I once watched a documentary in which this feat was compared with a single athlete winning both the 100 meter dash and the mile. Tony Hawk helped usher in skateboarding as a professional sport and was dominant while doing so. Chris Sharma did the same with rock climbing. Rich Froning Jr. has had early success in the burgeoning activity of crossfit as a sport, winning the title of “Fittest Man on Earth” four times since 2011.

Anderson Silva had a long run of dominance in MMA and you’ve certainly heard of some of boxing’s all-time greats. Ronda Rousey garnered fame for her win streak until she was beaten just this year; she also appeared in the horrible movie version of HBO’s Entourage, though I liked her performance. If you’ve ever been to the ballet you know it can be extremely athletic. How’s that for an inspirational commercial? Perhaps it’s time we consider ballet a sport?

And then there is this horse.

Tennis has a history of dominant players including two current players: Novak Djokovic and Serena Williams. Serena is already generally considered the best female player of all time and Novak may end up the greatest men’s player before his career is over. Previous generations included Steffi Graf, Martina Navratilova, Roger Federer, Pete Sampras, and many others. Each was extremely dominant during their prime. For example, during his prime Roger Federer held the Number 1 position for 302 consecutive weeks, reached 23 consecutive Grand Slam tournament semifinals and won five consecutive times both at Wimbledon and the US Open and three out of four at the Australian open.

Perhaps a dark-horse contender for most dominate athlete is Kelly Slater, the American professional surfer who won five consecutive titles from ’94 to ’98. There are a number of articles suggesting he may be the greatest male athlete of all time. He won his first title at age 20 and his last at age 39 (and he’s still surfing competitively!). Talk about longevity. Imagine if Kobe Bryant was leading the Lakers to a title this year or if Peyton Manning had been truly great in the Bronco’s Super Win and you have some idea of what Kelly Slater has accomplished. (Yes, I realize surfing is a non-contact sport. Or is it?).

What have I forgotten? Surely there must be a lot. Certainly, this list is too U.S. centric.

But back to the question at hand. There have been many conversations about whether the UConn women’s dominance is bad for women’s college basketball. It has been suggested by some that this is a sexist argument, but I disagree. If Kentucky’s men’s basketball team was on the verge of winning its fourth straight NCAA tournament there would certainly be discussion about their dominance, perhaps around allegations of illegal recruiting or steroid use or at the very least a discussion about reforming the current one-and-done system.

And the question of whether a team can be too dominate is not new. Indeed, many professional sports are structured specifically to provide — or at least attempt to provide — equity among smaller and larger markets. Think of the draft or salary caps. Of course, in individual sports we fear dominance less because we know natural aging will create a new wave of competition in a few years time, or if we’re talking about individual college sports the athlete will simply graduate.

But we also understand that long-term equilibrium can occur where success begets success. College players, shamefully, are not paid in dollars so the next best thing is to be paid in wins. UConn seems to be the central bank in that category.

On the other hand — and as the list above eludes to — dominance is not unique to the UConn women. In fact, in the grand scheme of things they aren’t so dominate after all. But in some sports we’re use to seeing new champions more often than in others, if only because most people in the U.S. only follow the big four. We’re use to seeing new men’s champions every year to be sure, even if they’re all generally from the same group of ten or twenty teams year after year. So it really stands out when the same women’s team wins repeatedly regardless of where they stand in the broader historical spectrum.

The best thing, it seems, would be for Syracuse to beat UConn and put the whole matter to rest.

Steph Curry is Awesome

There have been many, many blog posts about Steph Curry’s dominance this year but let me add one more just for fun. Using data from dougstats.com, I looked into Curry’s dominance in 3-point shooting.

The average number of 3-pointers made so far this season (excluding Steph Curry) is 42. However, this isn’t exactly the group we want to compare Steph against, since we wouldn’t consider, say, DeAndre Jordan his peer in terms of 3-point responsibility. Instead, I considered guards that have played in 60+ games so far this season. After doing so the average number of 3-pointers made about doubles to 87 (again, excluding Curry). Meanwhile, Steph Curry has 343 threes and is on track to finish the season with 398, more than one hundred more than his own single-season record. Here’s how the outlier that is Steph Curry looks graphically.

Four years ago Klay Thompson would’ve been on track to beat Ray Allen’s single-season record, but because of Curry, Thompson has to settle for a distant second.

Screen Shot 2016-03-24 at 5.37.27 PM.png

Curry has been ahead of everyone else all season long and this distance only grows larger with each game as this chart shows (made with data from Basketball-Reference.com):

Screen Shot 2016-03-25 at 4.07.50 PM.png

How rare is Steph Curry’s season? If we think of creating an NBA guard as a random normal process and give it this seasons mean and standard deviation of three pointers made we can get a rough idea. As it turns out the distribution of threes is skewed (as you might expect), but if you squint a bit you can see the distribution of the square root of each player’s three pointers made is approximately normal (this was revealed by using the PowerTransform function in R’s car package).

Assuming the parameters above we would expect to see a “2015-2016 Steph Curry” about once every 200 seasons.

Screen Shot 2016-03-25 at 7.33.10 PM.png

Here is Curry’s shot chart so far this season (using data from stats.NBA.com and this tutorial from The Data Game):

Screen Shot 2016-03-25 at 10.14.03 PM.png

Will a 16 seed ever beat a 1 seed?

That question arose during a recent dinner with my friend Graham at a popular pizza restaurant in Seattle. Tony Kornheiser of PTI said last week that it will never happen. Graham agrees. I think it will happen in our lifetime. It has almost happened a number of times already.

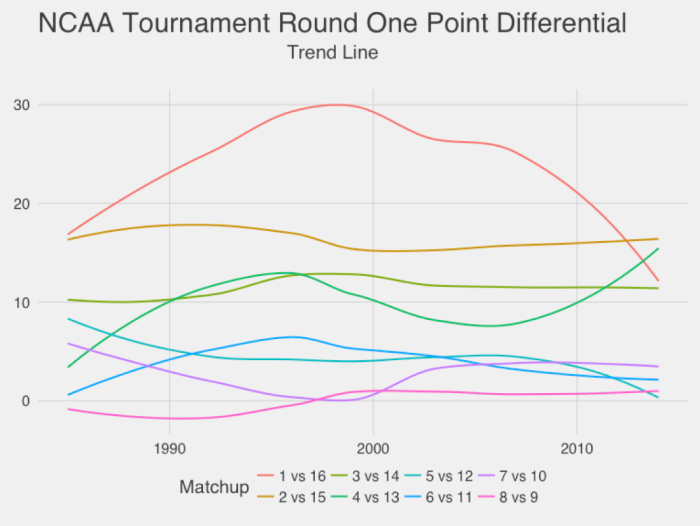
It seemed to me from casual observation like 16 seeds are getting closer to winning on average, but I decided to check this by plotting the point differential of higher-seeded teams during the first round of the NCAA tournament (in the first round there are four 1-vs-16 games). Indeed, compared to many other matchups the 1-vs-16 matchup has shifted greatly over time.

Screen Shot 2016-03-19 at 12.03.18 AM.png

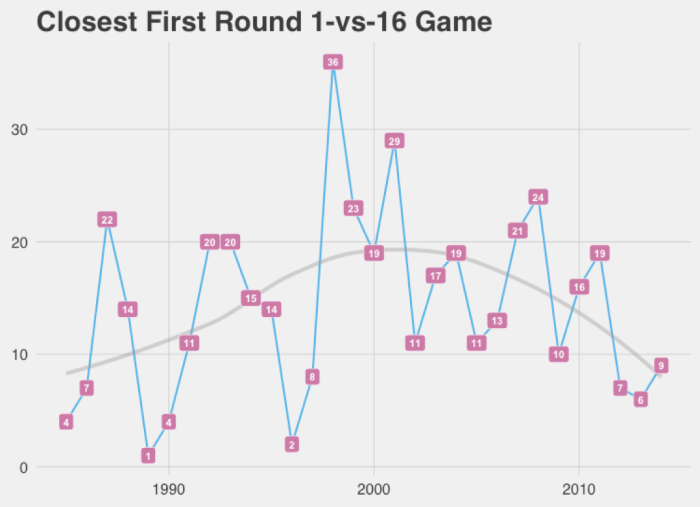
The margin of victory is still substantial, between 10 and 15 points so far this decade, but I remain confident that, let’s say, sometime in the next 40 years it will happen.  There have already been eight 15 seed victories over number 2 seeds and twenty-one 14 seed wins over 3 seeds. The situation looks even better when you consider the closest 1-vs-16 game during each tournament (since we only need one 16 seed to win).

Screen Shot 2016-03-22 at 1.36.38 PM.png

It seems that about two to three times every decade there are relatively close 1-vs-16 games and about once a decade there is an extremely close game (decided by just a couple of points). The 2000s did not fare well for 16 seeds.

I think the outcomes of close games are more stochastic than most. Leadership attribution bias seems to turn these stochastic events into narratives of late-game heroics and we’re prone to say that the 1 seed is more poised and resistant to pressure than players at smaller schools. Of course the history of the tournament has shown us many, many exceptions to this rule (if it’s a rule at all). At tension with this narrative is the story of the underdog that is just happy to be at the tournament and has nothing to lose, playing loose, having fun, and playing “to win” while the nervous champion is playing “not to lose.” So to me many of these games are closer to a coin flip than we like to think and given enough coin flips a tail is bound to come up eventually.

Also, think about it this way: How much difference is there between a 1 seed and a 2 seed, and between a 15 seed and a 16 seed? As you know if you ever watch the tournament seeding show there isn’t much of a difference. The lowest ranked number 1 seed isn’t much better – and could be worse – than some of the number 2 seeds, and eight times has a two seed lost in the first round. Of course you could argue the 2 seeds that lost should have actually been 3 seeds, although this year Michigan State lost as a number 2 seed and many considered them to be a favorite in the entire tournament (by some measures this is the biggest tournament upset ever). The larger point is that seeding is also somewhat stochastic and the question “can a 16 seed beat a 1 seed” is really the question of whether an overmatched team can exhibit a one-time victory over an opponent that is much more dominant on average. And we already know the answer to this question is “yes.”

To give the other side its due, since 1979 when seeding began, 22 of the 37 NCAA Tournament winners have been 1 seeds, so at least some of the top seeds are properly ranked and 16 seeds will have a tough time beating them when ranking is accurate.

It’s also a question as to why the decrease in point margin has occurred. Keep in mind the plot above is just a second-order trend line, although if you plot the underlying year-by-year margin it does follow the trend on average (of course). It’s interesting that the late 1980s and early 1990s was a time of lower point differential for 16-vs-1 games and that this period also correlated with three wins for 2 seeds in the first round (1991, 1993, 1997). Likewise the past few years have seen another decrease in 16-vs-1 game point differential and another string of 2-seed wins, two in 2012 and one each in 2013 and 2016. Similarly, between 1986 and 1999 there were thirteen times that a 14 beat a 3, and since 2010 this has occurred another six times (the intervening years saw only two instances of this in 2005 and 2006). These two periods also correspond to the highly touted recruiting classes of Michigan in 1991 (famously nicknamed the “Fab Five“) and Kentucky’s 2013 “mega class.” It may be that there are episodic shifts in recruiting that systematically leave certain types of talent on the table for smaller schools to cull and develop. (Of course, it may be I’m just seeing patterns where none exist).

My recent memory is that although there are a few good schools that still get the best players, smaller schools have seen that if they recruit good players (particularly good shooters or traditional big men) and play as a team they have a chance at beating anyone in the first rounds and perhaps going deep into the tournament. This increases their confidence and performance. This is another reason I think a 16 seed will eventually beat a 1, because the recent years of the tournament have expanded our imagination of what is possible. Think about the well-known phenomenon of a 12 seed always beating a 5 seed. How nervous do you think 5 seeds are every year? How much of this consistency in a 12 beating a 5 is self-reinforcing and due to the 5 seeds having “the jitters” and the 12 seeds being relatively overconfident?