
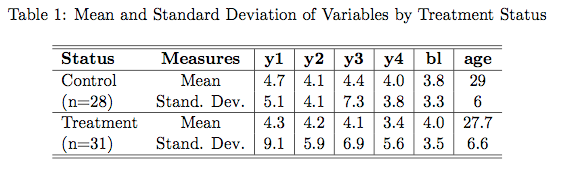
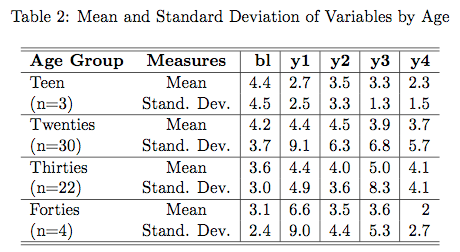
When doing my second HW for correlated data I came across some Stata packages that export LaTeX code directly. They are pretty similar to xTable in R. The first is the latabstat command, which is great at producing summary statistics. It outputs a LaTeX file that you can cut and paste into whatever program you are using (I use TexMakeker). Sometimes a little additional formatting is needed, but overall it’s a much better alternative to creating LaTeX tables from scratch. Here are a few examples.
The second is eststo function, which is part of a separate package you have to install. It’s great for getting regression output together in a table. You can call the eststo function multiple times and then use the esttab function, which will collate all results that were prefixed with eststo. See the code below for an example use. Here are a few result tables. Again, a little modification is needed, but they look pretty good straight out of Stata.
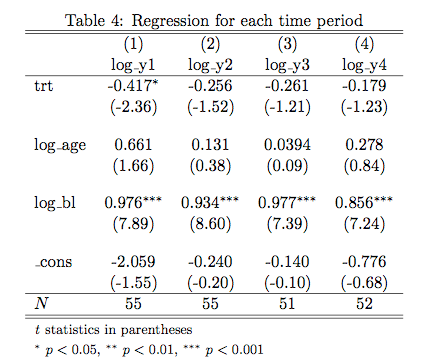
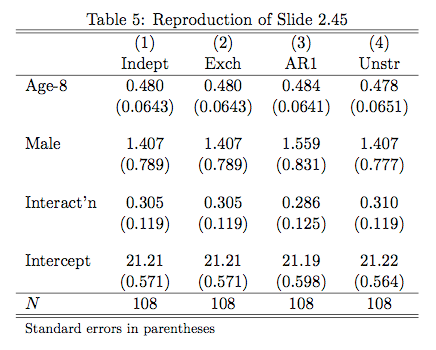
//  Load data
C:\Users\jjmacky\Documents\Stat 540 HW 2
insheet using seizurewide.csv, clear

//  Inspect data
br
codebook
inspect

/************ Problem 1 ************
//  Part i.
//  Examine data by treatment status
//  Normalize data so all variables are
//  in terms of counts per week
replace bl = bl/8
replace y1 = y1/2
replace y2 = y2/2
replace y3 = y3/2
replace y4 = y4/2

//  Simple table output
tabstat y1 y2 y3 y4 bl age, by(trt) stat(n mean sd) long format ///
nototal save
latabstat y1 y2 y3 y4 bl age, by(trt) stat(mean sd) long format  ///
nototal


//  Part ii.
//  Examine data by age
//  Create age groups
gen age_group = 4 if age replace age_group = 3 if age < 40
replace age_group = 2 if age < 30
replace age_group = 1 if age < 20
label define age_label 1 "Teen" 2 "Twenties" 3 "Thirties" 4 "Forties"
label values age_group age_label
//  Produce table
tabstat bl y1 y2 y3 y4, by(age_group) stat(n mean sd) long format
latabstat bl y1 y2 y3 y4, by(age_group) stat(mean sd) long format
//  Produce graph
scatter y time, by(age_group) ytitle("Seizures per Week") xtitle("Time")

//  Part iii.
//  Produce spaghetti plots
//  Run this after normalizing data by seizure rate
reshape long y, i(id) j(time)
drop if trt == 1
spagplot y time, id(id) ytitle("Seizures per Week") xtitle("Time")
//  Run this seperatly
reshape long y, i(id) j(time)
drop if trt == 0
spagplot y time, id(id) ytitle("Seizures per Week") xtitle("Time")
//  Another possible plot
label define trt_label 0 "Control" 1 "Treatment"
label values trt trt_label
meansdplot y time, by(trt) inner(1) ytitle("Seizures Per Week")  ///
xtitle("Time")

//  Part B, C, D
//  Run regressions
//  Create variables
gen yplus1 = y + 1
gen log_yplus1 = log(yplus1)
gen log_seizures = log(y)
gen log_age = log(age)
gen log_bl = log(bl)
//  Remove observations with no seizures (we are told to do this)
by id (time), sort: drop if y == 0
//  Run clustered regression
eststo: quietly regress log_seizures trt log_age log_bl, cluster(id)
//  Compare to no clustering
eststo: quietly regress log_seizures trt log_age log_bl, robust
//  Now repeat with yplus1 as the response
eststo: quietly regress log_yplus1 trt log_age log_bl, cluster(id)
eststo: quietly regress log_yplus1 trt log_age log_bl, robust
//  Produce Latex Result
esttab using reg1.tex, replace


//  Part E
//  Test effects on different times
//  Run without reshaping
//  Transform variables
gen log_y1 = log(y1)
gen log_y2 = log(y2)
gen log_y3 = log(y3)
gen log_y4 = log(y4)
gen log_age = log(age)
gen log_bl = log(bl)
//  Run regressions
eststo: quietly regress log_y1 trt log_age log_bl, cluster(id)
eststo: quietly regress log_y2 trt log_age log_bl, cluster(id)
eststo: quietly regress log_y3 trt log_age log_bl, cluster(id)
eststo: quietly regress log_y4 trt log_age log_bl, cluster(id)
//  Produce Latex Result
esttab using reg2.tex, replace

/************ Question 2 ************/
insheet using dentalwide.csv, clear
egen numsubject = seq()
drop subject
//replace subject = numsubject
reshape long distance, i(numsubject) j(agefrom8)
replace agefrom8 = agefrom8 - 8
gen male = cond(sex == "Male", 1, 0)

xtset numsubject agefrom8
eststo: quietly xtgee distance c.agefrom8##male, corr(independent) robust
eststo: quietly xtgee distance c.agefrom8##male, corr(exch) robust
eststo: quietly xtgee distance c.agefrom8##male, corr(ar1) robust
eststo: quietly xtgee distance c.agefrom8##male, corr(unstr) robust
esttab using gee.tex, se nostar replace

Formatted By Econometrics by Simulation
