Distribution Convergence

Let’s do a problem from Chapter 5 of All of Statistics.

Suppose X_1, \dots X_n \sim \text{Uniform(0,1)} . Let Y_n = \bar{X_n}^2 . Find the limiting distribution of Y_n .

Note that we have Y_n = \bar{X_n}\bar{X_n}

Recall from Theorem 5.5(e) that if X_n \rightsquigarrow X and Y_n \rightsquigarrow c  then X_n Y_n \rightsquigarrow cX .

So the question becomes does X_n \rightsquigarrow c  so that we can use this theorem? The answer is yes. Recall that from Theorem 5.4(b) X_n \overset{P}{\longrightarrow} X implies that X_n \rightsquigarrow X . So if we can show that we converge to a constant in probability we know that we converge to the constant in distribution. Let’s show that \bar{X}_n \overset{P}{\longrightarrow} c . That’s easy. The law of large numbers tells us that the sample average converges in probability to the expectation. In other words \bar{X}_n \overset{P}{\longrightarrow} \mathbb{E}[X] . Since we are told that X_i is i.i.d from a Uniform(0,1) we know the expectation is \mathbb{E}[X] = .5 .

Putting it all together we have that:

Y_n = \bar{X_n}^2
Y_n = \bar{X_n}\bar{X_n}
Y_n \rightsquigarrow \mathbb{E}[X]\mathbb{E}[X] (through the argument above)
Y_n \rightsquigarrow (.5)(.5)
Y_n \rightsquigarrow .25

We can also show this by simulation in R, which produces this chart:

y_convergence

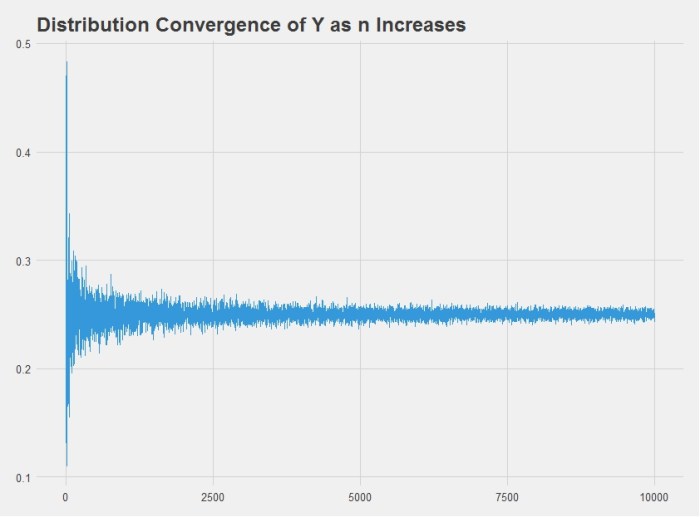
Indeed we also get the answer 0.25. Here is the R code used to produce the chart above:

# Load plotting libraries
library(ggplot2)
library(ggthemes)

# Create Y = g(x_n)
g = function(n) {
  return(mean(runif(n))^2)
}

# Define variables
n = 1:10000
Y = sapply(n, g)

# Plot
set.seed(10)
df = data.frame(n,Y)
ggplot(df, aes(n,Y)) +
  geom_line(color='#3498DB') +
  theme_fivethirtyeight() +
  ggtitle('Distribution Convergence of Y as n Increases')

How much disagreement is there about statistics?

So much that just this year the American Statistical Association put out a 12-page manuscript about p-values and it took them a year of discussion(!) before the manuscript was complete.

See also this very short 2006 article by Andrew Gelman and Hal Stern The Difference Between “Significant” and “Not Significant’ is not Itself Statistically Significant:

The error we describe is conceptually different from other oft-cited problems—that statistical significance is not the same as practical importance, that dichotomization into significant and nonsignificant results encourages the dismissal of observed differences in favor of the usually less interesting null hypothesis of no difference, and that any particular threshold for declaring significance is arbitrary…

In making a comparison between two treatments, one should look at the statistical significance of the difference rather than the difference between their significance levels. [Emphasis added].

And this related 2011 paper by Nieuwenhuis, Forstmann, and Wagenmakers, Erroneous analyses of interactions in neuroscience: a problem of significance, which found that half of the 160 papers reviewed, which all appear in top academic journals, used the wrong statistical procedure when evaluating p-values.